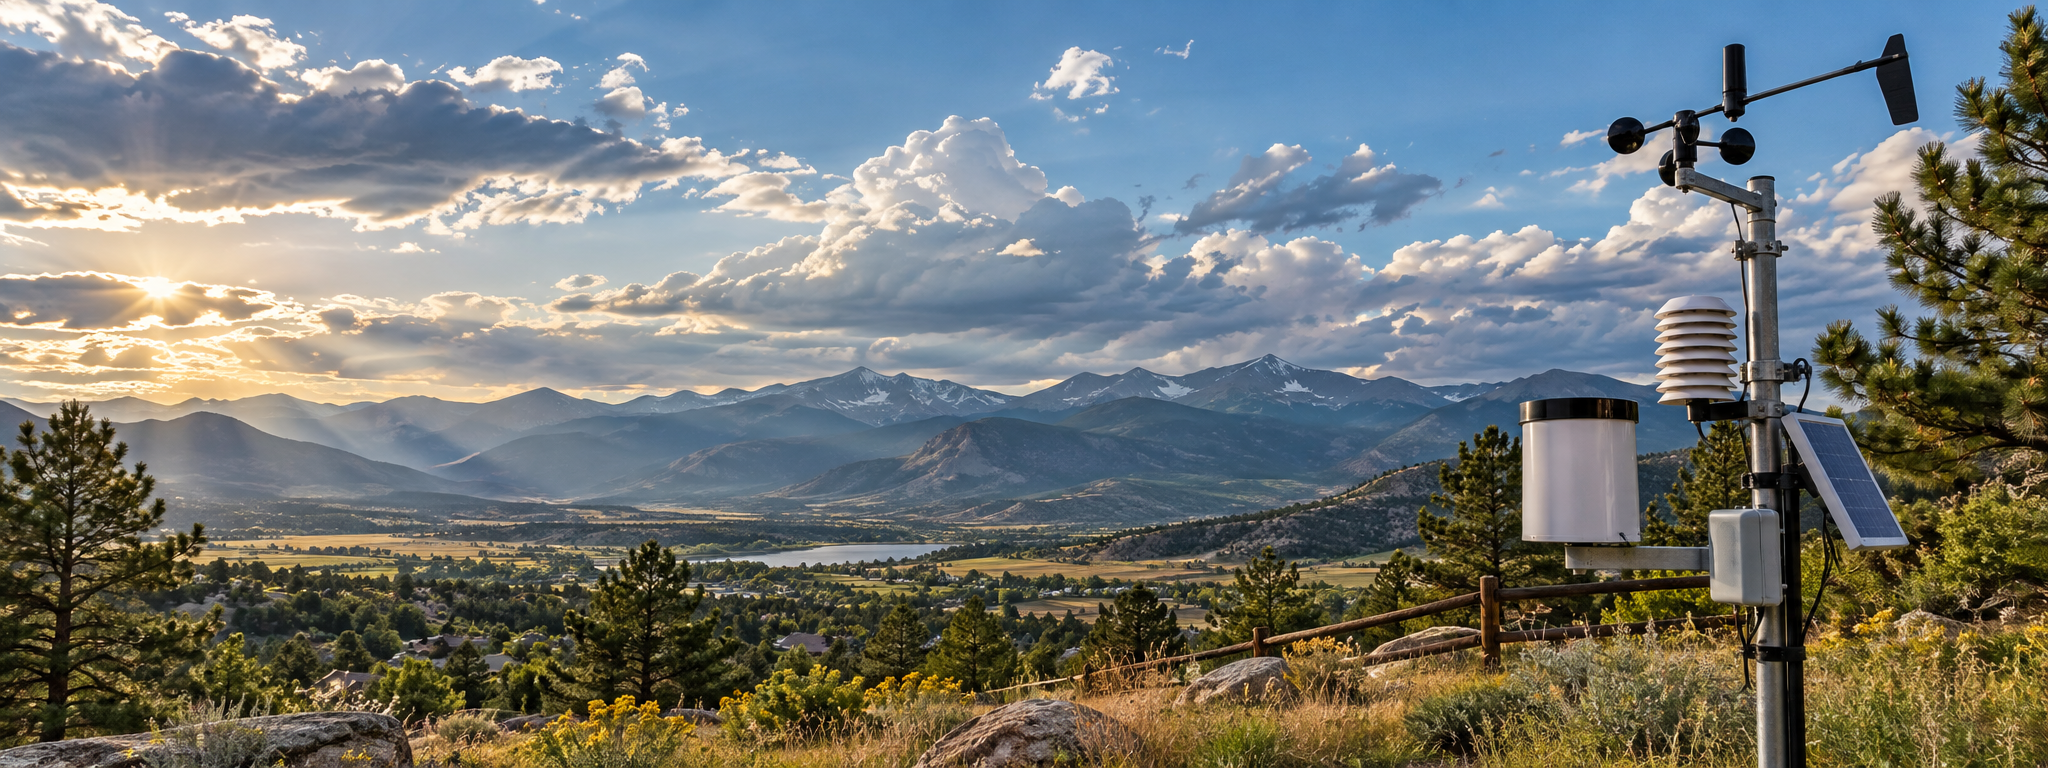
Weather Station
Live measurements, trends and sky conditions from Loveland, Colorado.
See what the atmosphere is doing—not just what the forecast predicted
A personal weather station measures the air at one specific location. The K5NWZ station reports conditions from my home QTH in Loveland, Colorado, helping with radio operation, off-road planning, gardening, storm awareness and ordinary decisions about the day.
What is this page?
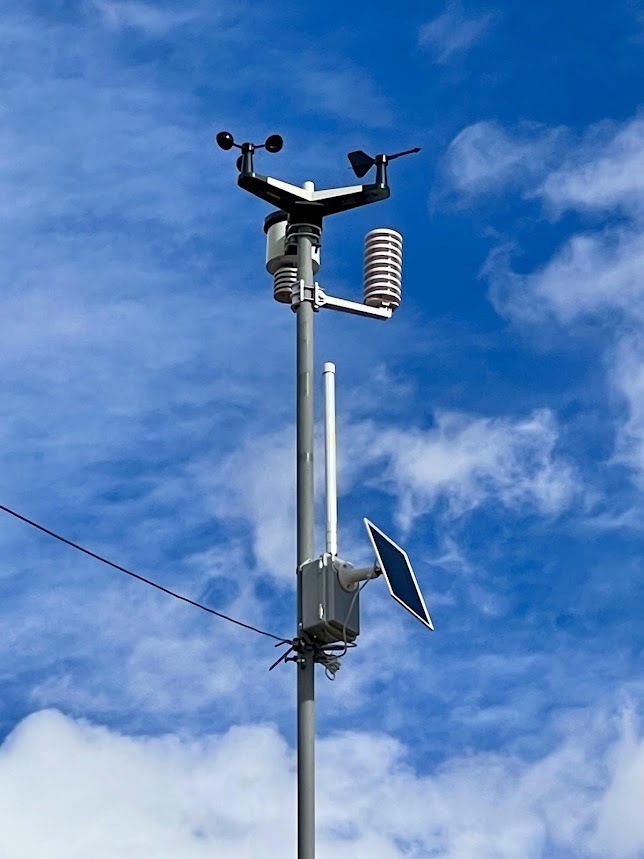
It is a live view of my Ambient Weather WS-2000. The outdoor array measures temperature, humidity, wind, rain, sunlight and UV. The indoor console adds barometric pressure, stores readings and sends them to online services where the measurements become graphs and history.
How a home weather station works
Sensors sample the air
The outdoor array measures local conditions at the station rather than estimating them from a distant airport.
The console receives data
A wireless link carries readings indoors to the WS-2000 color console for display and storage.
Wi-Fi publishes readings
The console sends selected data to Ambient Weather Network and Weather Underground.
Graphs reveal the story
A single number shows now. A graph shows the front, gust, pressure change or rain event that produced it.
The K5NWZ station
Ambient Weather WS-2000
This is a serious hobby station built around a solar-assisted outdoor sensor array, a separate indoor temperature/humidity/barometer sensor and a color Wi-Fi console.
Local—not an airport estimate
Loveland can vary sharply by neighborhood because of elevation, foothill winds, storms and Front Range microclimates. These readings come from this property.
Connected data
The same measurements can support the website, Weather Underground, Ambient Weather and—when configured carefully—Home Assistant automations and historical views.
What the WS-2000 measures
| MEASUREMENT | WHAT IT TELLS YOU |
|---|---|
| Outdoor temperature | The air temperature at the sensor. Shade and airflow matter; direct sun on a poorly shielded sensor can distort a reading. |
| Relative humidity | How close the air is to saturation. Humidity combines with temperature to influence comfort, dew, fog and heat-index calculations. |
| Dew point | The temperature at which moisture begins condensing. It is often a more intuitive measure of how dry or muggy the air feels. |
| Wind speed, gust and direction | Sustained movement, short peaks and the direction the wind comes from. Gusts matter for antennas, portable operations, high-profile vehicles and fire weather. |
| Rain rate and totals | How intensely rain is falling plus accumulation for an event, day, week, month and year. A tipping mechanism inside the collector counts rainfall. |
| Barometric pressure | The weight of the atmosphere. The trend is often more useful than one number: a quick fall can accompany an approaching system, while rising pressure often follows it. |
| Solar radiation and UV | Solar energy and ultraviolet exposure. These readings help explain heating, evaporation, solar production and sun-exposure risk. |
The WS-2000 sensor array and measurement descriptions are based on the official Ambient Weather manual and product documentation. View the official WS-2000 information ↗
Live readings and graphs
The dashboard below is the real public feed from the K5NWZ station. Start with the current readings, then look at the graphs. Compare temperature with solar radiation, wind gusts with pressure, and rain rate with daily accumulation. Those relationships are where raw numbers become useful weather information.
Live K5NWZ WS-2000 dashboard
The complete public station dashboard is displayed below, including current values, history and graphs.
How to read the graphs
Look for direction
A steady pressure fall or temperature rise tells more than a momentary reading. Ask whether the line is rising, falling or holding.
Compare related lines
Did temperature fall when wind shifted? Did humidity jump as rain began? Weather variables work together.
Notice the time scale
A five-minute gust, a daily temperature cycle and a seasonal rain total answer different questions. Select the time range that matches the question.
Expect local effects
Trees, buildings, mounting height and terrain affect wind and rain readings. A personal station describes its site, not every part of Northern Colorado.
Check sensor health
A flat line, impossible jump or long gap may be maintenance or connectivity—not an extraordinary weather event.
Use official warnings
This is an educational personal station. For hazards and warnings, use the National Weather Service and local emergency information.
Live weather camera
The camera adds visual context that instruments cannot: cloud cover, visibility, precipitation and changing light over the Front Range.
Weather decisions at a glance
The station becomes more interesting when the measurements are connected to real decisions. These are examples—not automated safety declarations—and official warnings should always come from the National Weather Service.
Antennas and portable masts
Watch sustained wind and gusts. A calm average can hide a short gust strong enough to strain a mast, rotator or temporary antenna.
Off-road and camping
Temperature swings, rain rate, wind direction and falling pressure help explain what a field crew may encounter beyond the pavement.
Fire-weather awareness
Low humidity, warmth and wind can combine into dangerous drying conditions. Use official fire restrictions and warnings for decisions.
Radio conditions
Terrestrial weather does not control HF propagation the way solar activity does, but fronts, temperature inversions and storms can affect VHF/UHF paths and station noise.
Visibility and the camera
Compare humidity and dew point with the camera view to recognize haze, fog, precipitation and rapidly changing foothill visibility.
Freeze and heat protection
Temperature history can drive Home Assistant alerts for pipes, batteries, plants, equipment enclosures and outdoor projects.
Home Assistant and future local data
What Home Assistant can add
Home Assistant can combine station readings with indoor sensors, air quality, power use, alerts and automations. It can also retain local history and build purpose-specific dashboards—for example, an antenna wind alert, freezing-temperature warning, high-UV notification or rain-triggered reminder.
The important distinction: the public page should receive only deliberately published weather values. It should not expose the private Home Assistant dashboard, credentials or unrelated household devices. The current Ambient Weather feed supplies the public live data safely; a later read-only relay can add selected Home Assistant graphs if there is a clear reason to do so.
Why weather belongs on K5NWZ
Weather connects nearly every interest represented here. Wind affects antennas and portable masts. Temperature and precipitation shape off-road trips and camping. Solar activity and terrestrial weather influence radio in different ways. Meshtastic nodes can carry environmental telemetry. A local station turns all of that into something measurable, visible and worth investigating.